We compared Datawisp with the biggest BI tools' AI assistants. See how we did.
Facts Break Ties
Smart decision makers use data.
Datawisp answers any data question in just a few seconds.


Datawisp is an essential tool for marketing Honeyland. The user-friendly interface ensures that everyone on the team can contribute to the data-driven decision making process regardless of their technical background.
Gabriel Tan
User Acquisition at Honeyland

Let me quickly say, as a former data lead at a finance place, I’m LOVING this tool and praying for your widespread adoption.
Connor Cone
CTO at MyPeachWhy do I need this?
Modern, successful companies aren't run on gut feeling alone.
Datawisp gives you the insights you need to excel without relying on a data person.
Like Siri for your business data
No need to learn a new piece of software - just talk to Wispy like you would a human data analyst. You can ask follow up questions, request changes, and iterate all in plain language using your voice.
Save time and iterate faster
Wispy is always available and answers your questions in just a few seconds. Get the insights you need without being at the mercy of someone else's schedule.
All your data in one place
Wispy can combine all your data to answer more complex questions - so there's no need to spend time joining tables or trying to figure out which data set has the answers.
Fast and secure
Datawisp works by connecting directly to your database. This keeps it fast, cost efficient, and secure - since we don't need to copy all your data.
Built for enterprise
Datawisp isn't just another chatbot - it's a full-featured data platform fit for enterprise use.


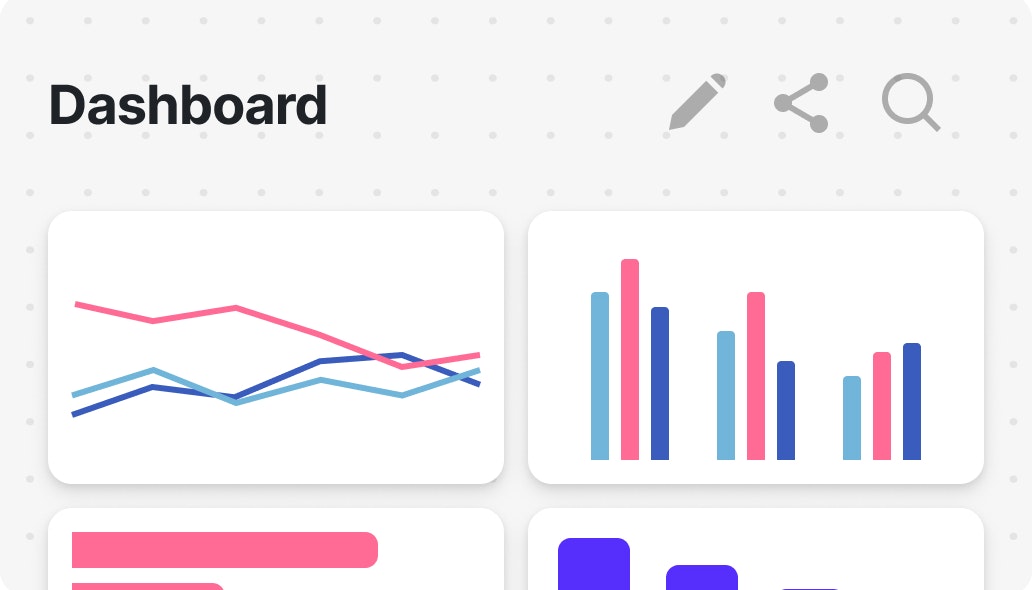
Persistent sheets and dashboards
Datawisp lets you save any AI-created work and add it to a dashboard that you can come back to as needed.


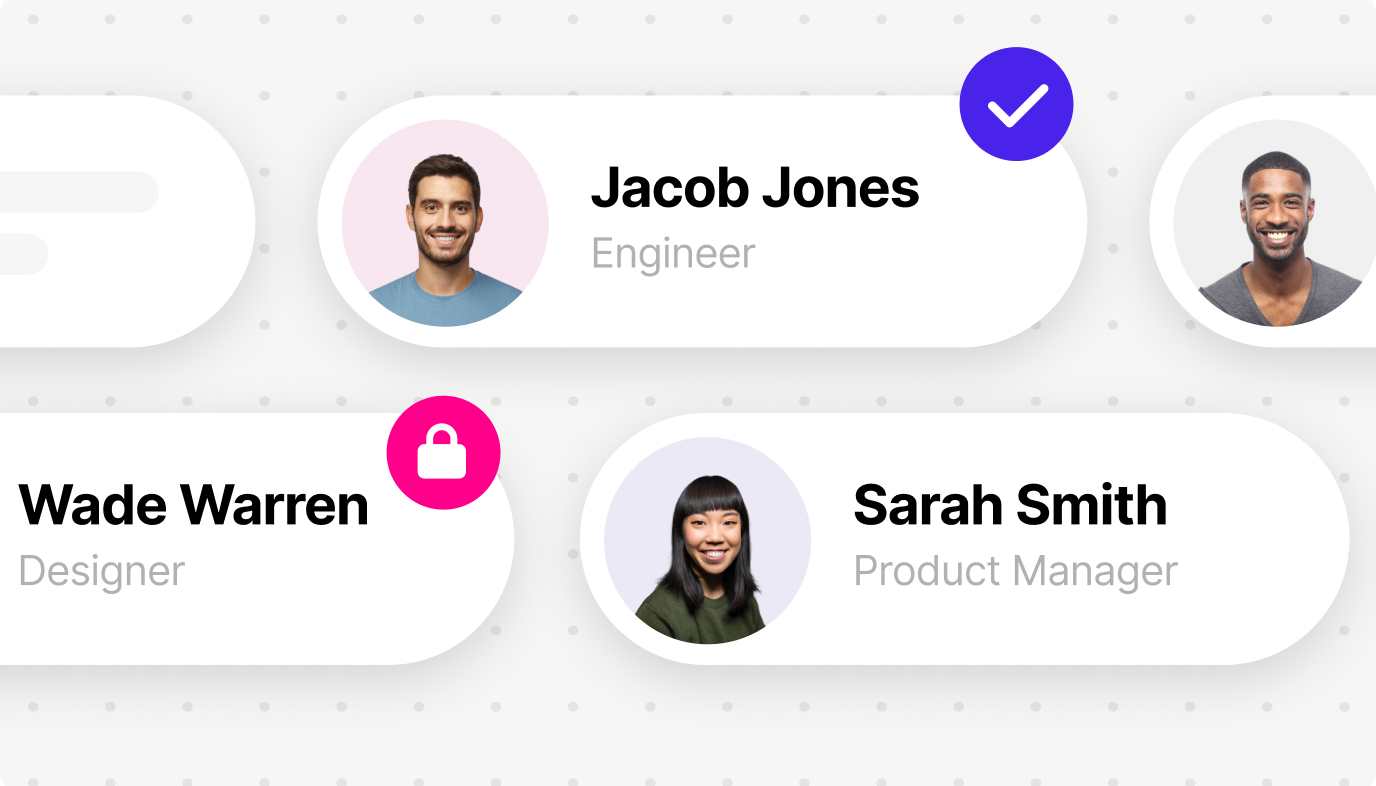
Collaborate in real-time
Invite your whole team to work together and solve business challenges using data. Share worksheets, data sources, and more.


Safe and secure
Queries run directly on your database and Datawisp can be deployed entirely within your cloud. Your CISO will love us.
FAQ
Datawisp leverages AI to eliminate the need for humans to learn code. Wispy, our data assistant, takes a user's question, figures out the code needed to answer that question, writes it, and runs it directly on your database - just like a data scientist would.
Generally, Wispy performs best with questions where the answer can be represented as a table or a chart. We have a more detailed guide on how to ask effective questions that you can check out here.
Datawisp is the only AI-powered analytics platform that is fully interpretable by non-technical users. Our no-code block interface always shows you the exact steps Wispy took to answer your question so you can be confident in its results.
No, nor does it attempt to. Datawisp can help business people answer most simple data related questions on their own, freeing up data professionals to work on more ambitious projects (e.g. those involving machine learning) and to make sure the company maintains clean data and effective data governance practices.
Since Wispy is an agent, not a chatbot, it can run queries directly on your database. This means that Datawisp never needs to copy your whole data and/or send it to an LLM or other third party. We've designed Datawisp and Wispy to only look at the information needed to answer the question - no more.
Currently we use GPT-4o since it performs the best in our benchmarks.