Data Done Differently
Most people today go to someone else for their data questions - we built Datawisp to mimic this interaction.
Wispy can reason like a human analyst and converse with anyone at your company.


Works like a real data scientist


Fully interpretable
Our block system gives full transparency into AI generated results, so you can know exactly how Wispy got every answer.

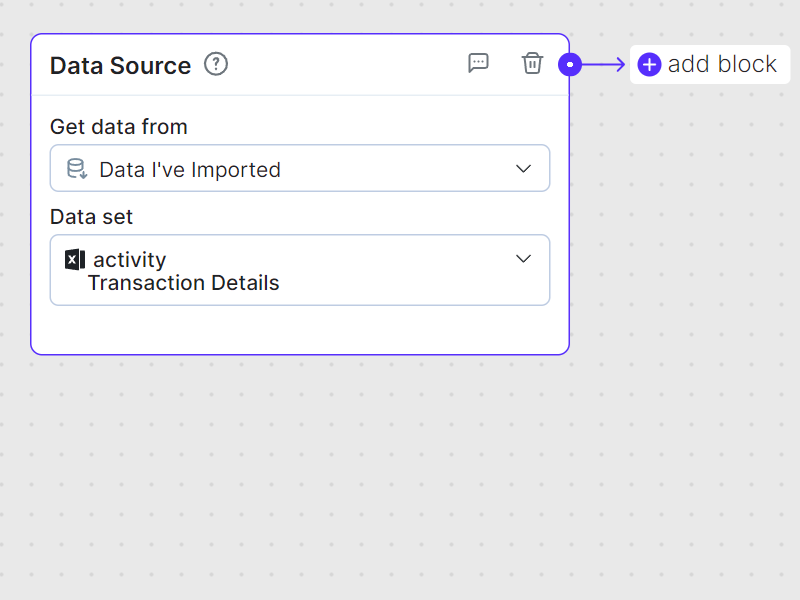
Data Source
The data block represents the data that you're analyzing. It's the starting point for all analysis.
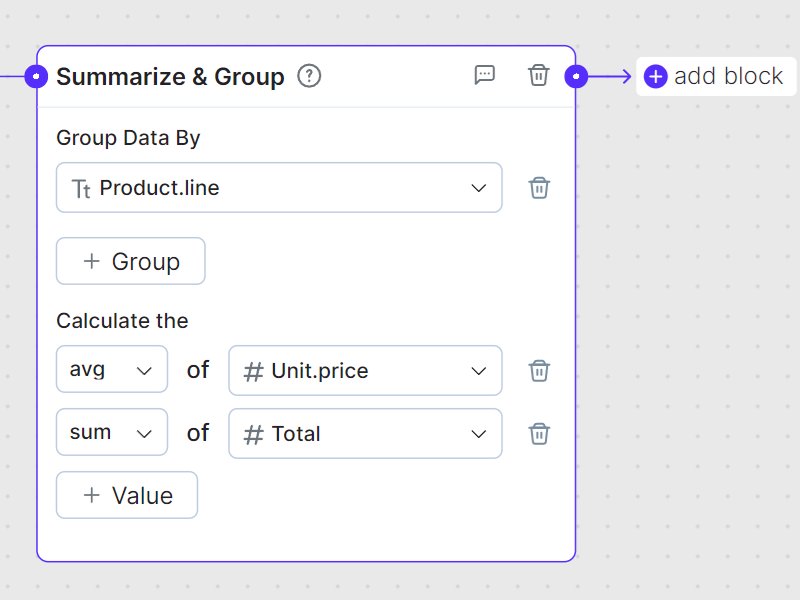
Summarize / Group
Quickly understand overall trends in your data with summary metrics. Calculate values like count, sum, average, etc. for any grouping of data.
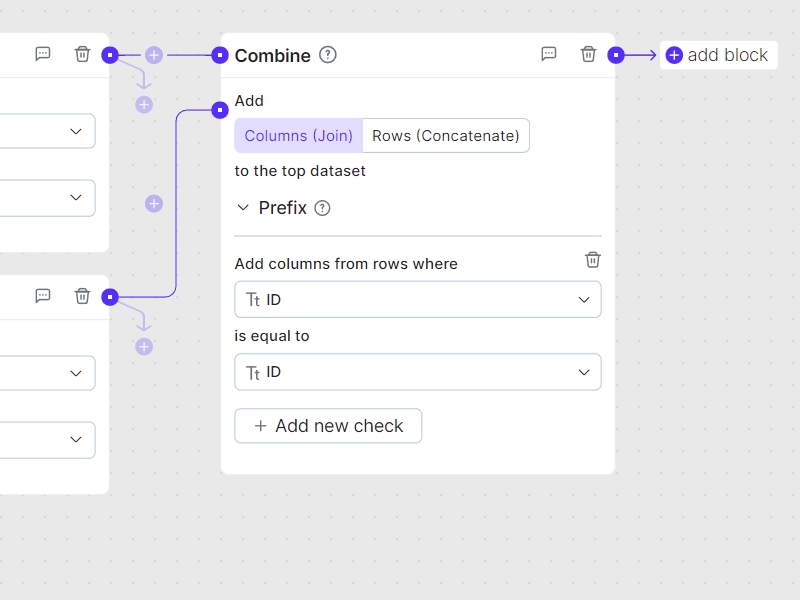
Combine
Combine lets you easily add rows or columns from one data set to another, so you can leverage all the data at your dispoas
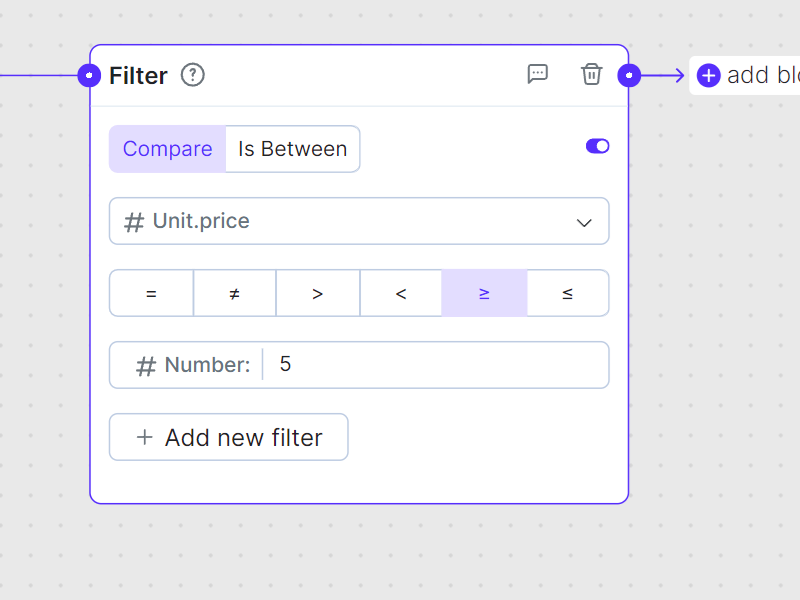
Filter
Filter lets you cut or segment your data by removing certain rows.
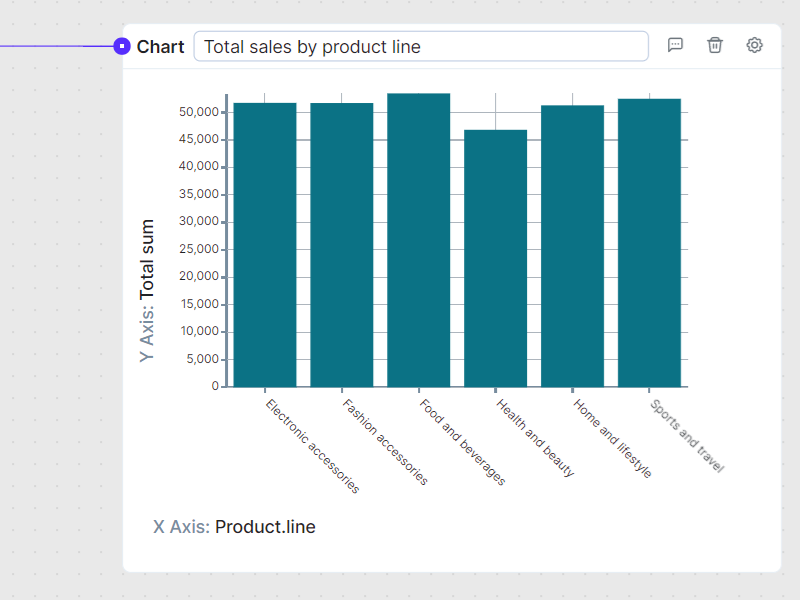
Chart
Visualize your data in a chart and share it with stakeholders.
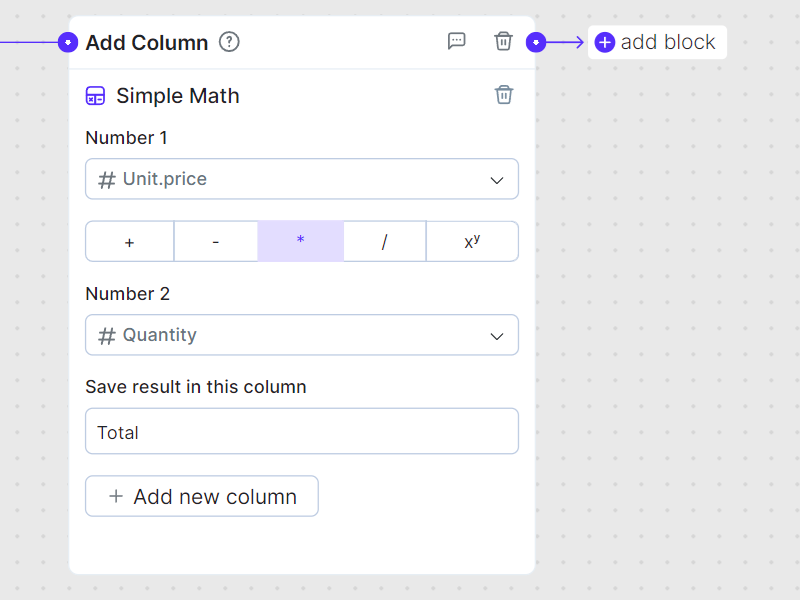
Add Column
Add a new column, then pick what goes in it. You can choose from a range of calculations and True/False conditions.
Works with your data
Datawisp works with most major data types and lets you combine all your data in one place.
If you don't see your data source listed, we can still make it work. Email us at hello@datawisp.io.
Files
You can upload files directly from your computer to Datawisp. We’ll store them in your account.
Supported
 .CSV
.CSV .XLSX
.XLSX .JSON
.JSON Google Sheets
 .TSV
.TSV
Databases
Connect to your data directly and get up-to-date analytics at any time.
Supported
 PostgreSQL
 MySQL
MySQL MariaDB
 Microsoft SQL Server
 Snowflake
 Amazon Redshift
 Google BigQuery
- MotherDuck
![MotherDuck]()

Web 3
Easily access your on-chain data, combine it with web2 data, and make the most out of the metaverse – right here in Datawisp.
Supported
 Solana
- Ethereum
![Ethereum]()
- Polygon
![Polygon]()
- Avalanche
![Avalanche]()
- Arbitrum
![Arbitrum]()
Features
Datawisp comes packed with features designed to reduce friction and get you started analyzing data ASAP.
Ease of use
AI-powered data assistant you can talk or type to
Ask questions about your data in plain English
Beginner friendly interface free of technical jargon
Analysis
Ask any data question
Create charts and dashboards to see live metrics
Analyze trends in data over time
Calculate churn and retention
Track critical customer segments across their lifecycle
Support
Onboarding support from real humans to get you started without wasting time
Access to our own in-house data science team
Dedicated Slack or Discords channel for your team so you can get help immediately
Data management
Connect directly to live databases
Process data directly on your own infrastructure, unlike other AI tools
Import files from your PC
Standard data format makes combining different data sets easy
No complicated data pipelines to set up - works with your raw data
Collaboration
Collaborate in real-time just like Google Docs
Create teams and invite the right people to collaborate on your project
Build a common language for data analysis across your company by connecting Datawisp Blocks together
Export and sharing
Share in multiple ways to the right audience: dashboards, pipelines, or read only sheets
Easily export charts and tables to external tools like Excel and PowerPoint
Create public share links to share on your social platforms and elsewhere
Connect Datawisp analysis to your platform of choice via API
Security
SoC2 Certified
Hosted in a DIN ISO/IEC 27001 certified data center
Separate managed instance / own cloud / on prem available