

Datawisp DevUpdates | May 2023 - Improved New User Experience, Tutorials, Amazon Redshift and Snowflake
Here are some of the top DevUpdates for the month of May 2023 - Follow us on Twitter and LinkedIn for more DevUpdates!
This month we were single-mindedly focused on improving the new user experience. Well, we also fixed bugs, improved performance, and added 2 new integrations.
Improving the New User Experience
Often the hardest part of using a new analytics platform is getting started. We combed through roughly 50 sessions on Usertesting.com to figure out the best ways to improve our user’s onboarding experience.
One big thing we immediately noticed is that there were lots of small annoyances in the UI that tripped up users. We’ve added new features to reduce frustration and help the user while onboarding to the platform.
Icon Tooltips
When using the platform for the first time, users had a hard time understanding what some of the icons in the workspace toolbar meant. Adding tooltips to the buttons was an easy win, and makes it much more visible what different buttons do.


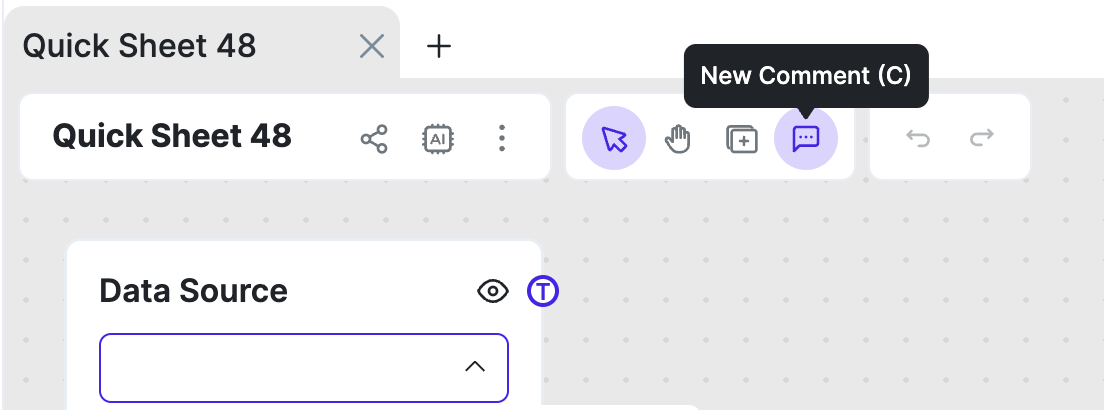
Improved New Block / New Comment Modes
In one particularly frustrating user testing session, the tester enabled the “new comment” mode, and was completely stumped why clicking anywhere created white rectangles.
In order to make this action more intuitive, we reworked the “New Block” and “New Comment” modes to only create one block, and gave them hotkeys. Now, it’s hopefully a lot less confusing, and it’s probably how all of this should have worked in the first place.
Intuitive and More Searchable Add Block Menu
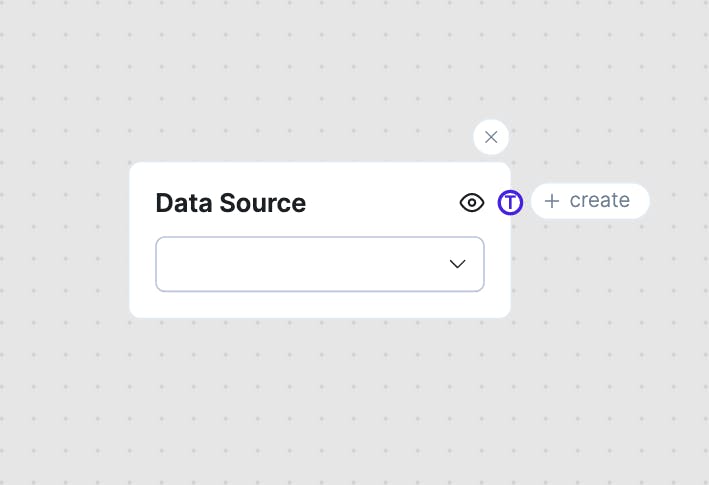
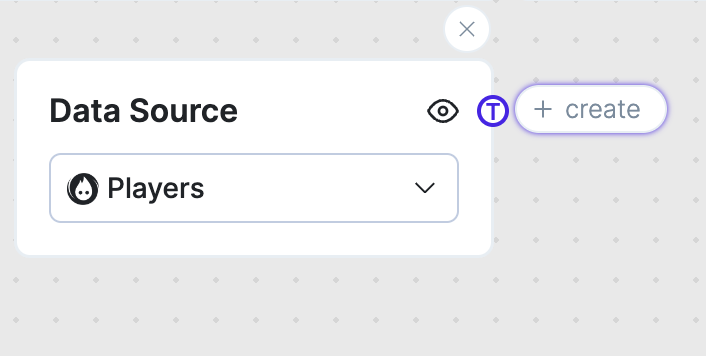
For new users, after adding a data source, one of the first actions you need to take is to connect that data source to a logic block to transform it. However, we noticed that for those who hadn’t used a node-based interface before the action to “click and drag a connector” was not at all intuitive!
We added a big “create” button and users had a much easier time.


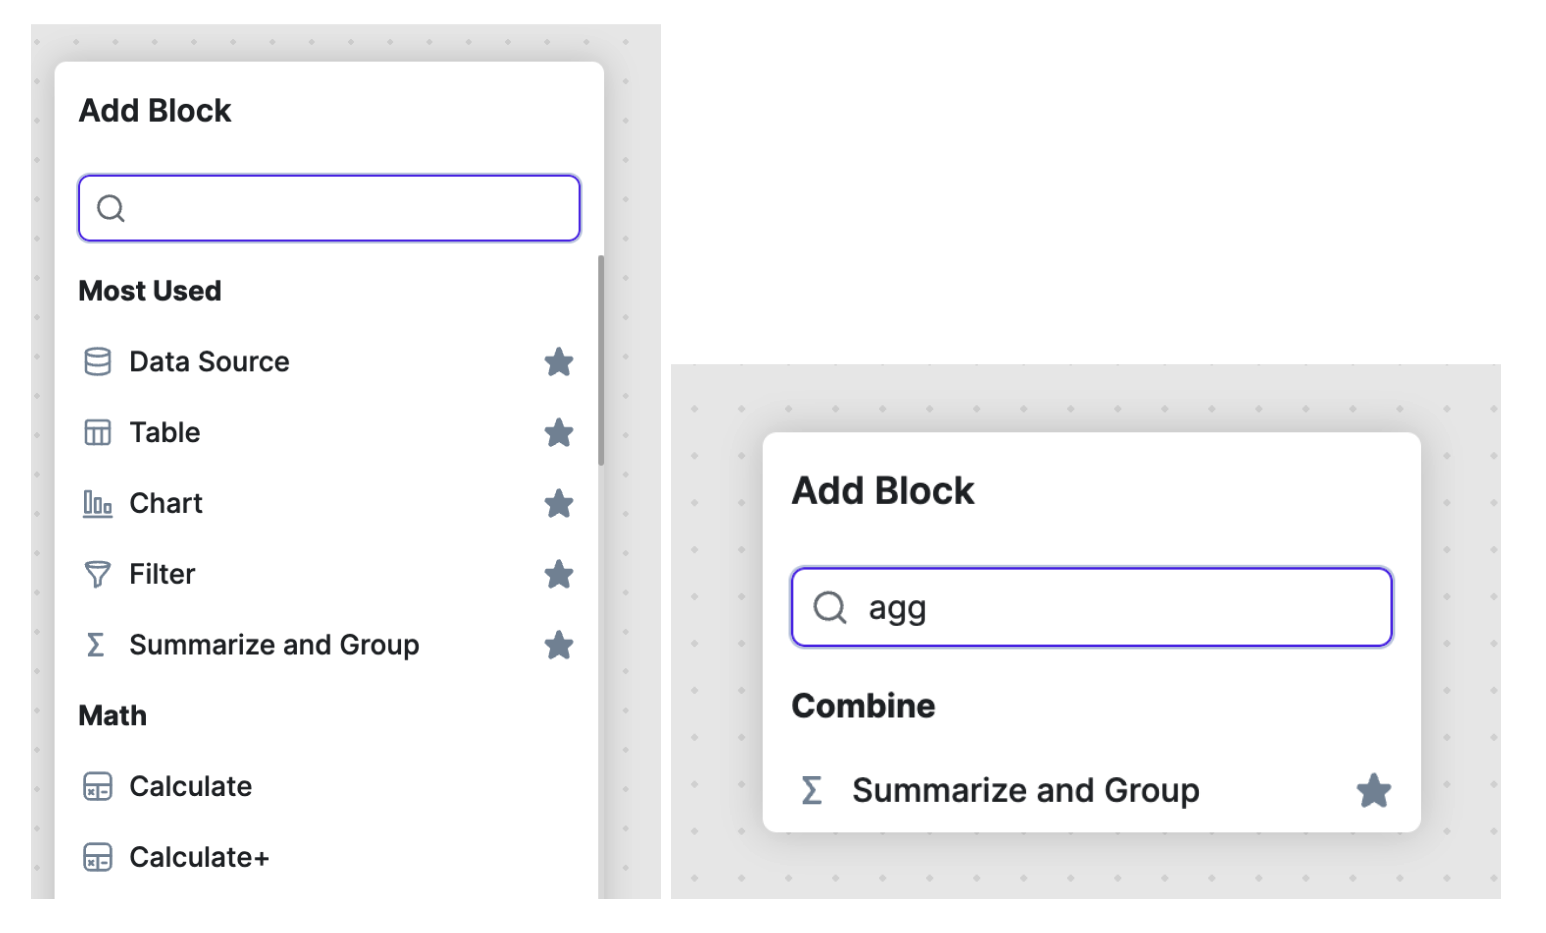
In addition, some users struggled with finding the right blocks for their task.
They are now more browsable - we added categories to the “Add Block” menu and more searchable - added aliases (if you search for “Aggregate”, you find “Summarize and Group”). Whether you browse or search for the function you need, it’s now much easier to find what you’re looking for.


In the end, there are even more small changes we made to improve the onboarding experience, and you can really see the difference in the ways users onboard to the platform, which is amazing!
Going forward, this will be a regular part of our efforts, to truly reach our goal of making data analysis accessible to everyone.
New User Tutorial and videos
We’ve experimented with tutorials for new users.
Next time you open Datawisp, you can try it out for yourself in the Help Menu. (Help -> Open tutorial sheet)


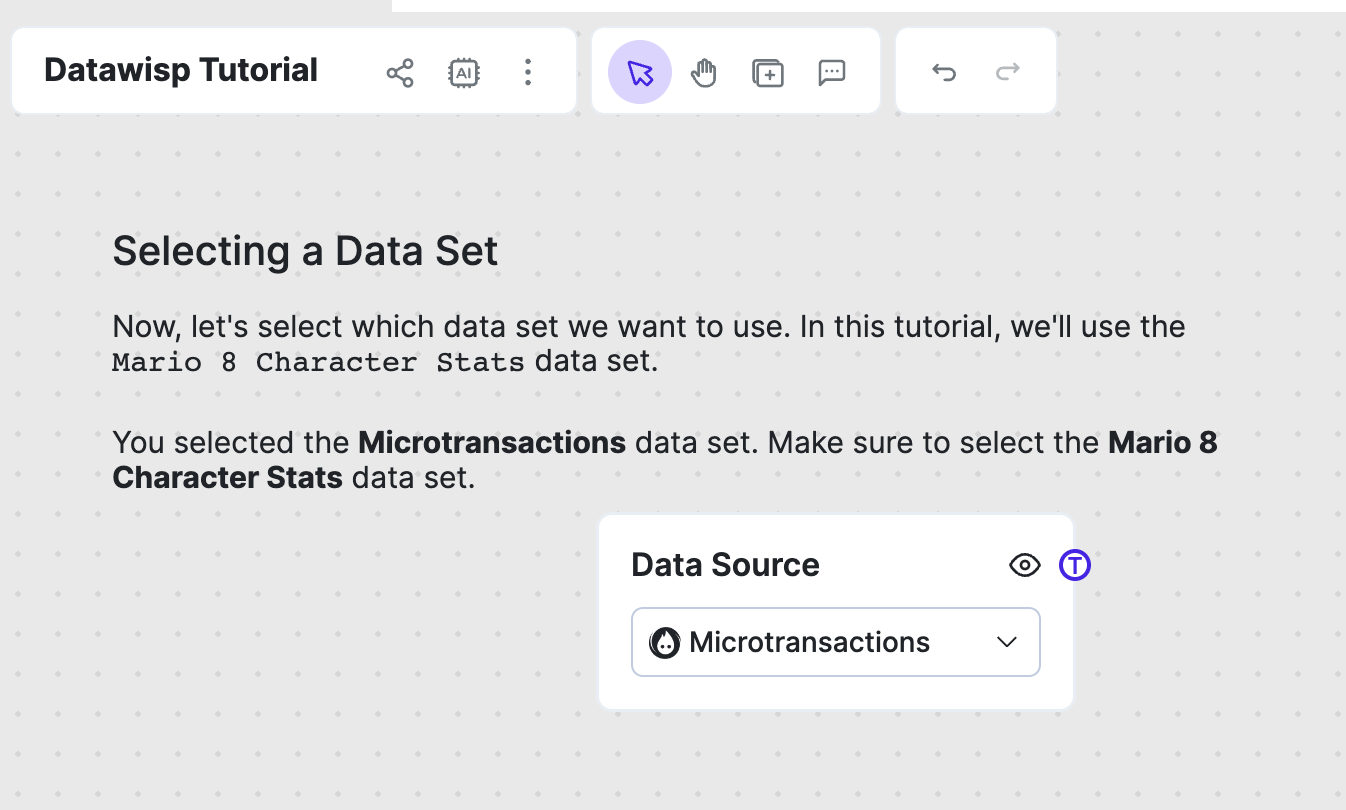
This is just a prototype (which is why it’s not enabled by default yet), but in our tests it’s already helped a ton!
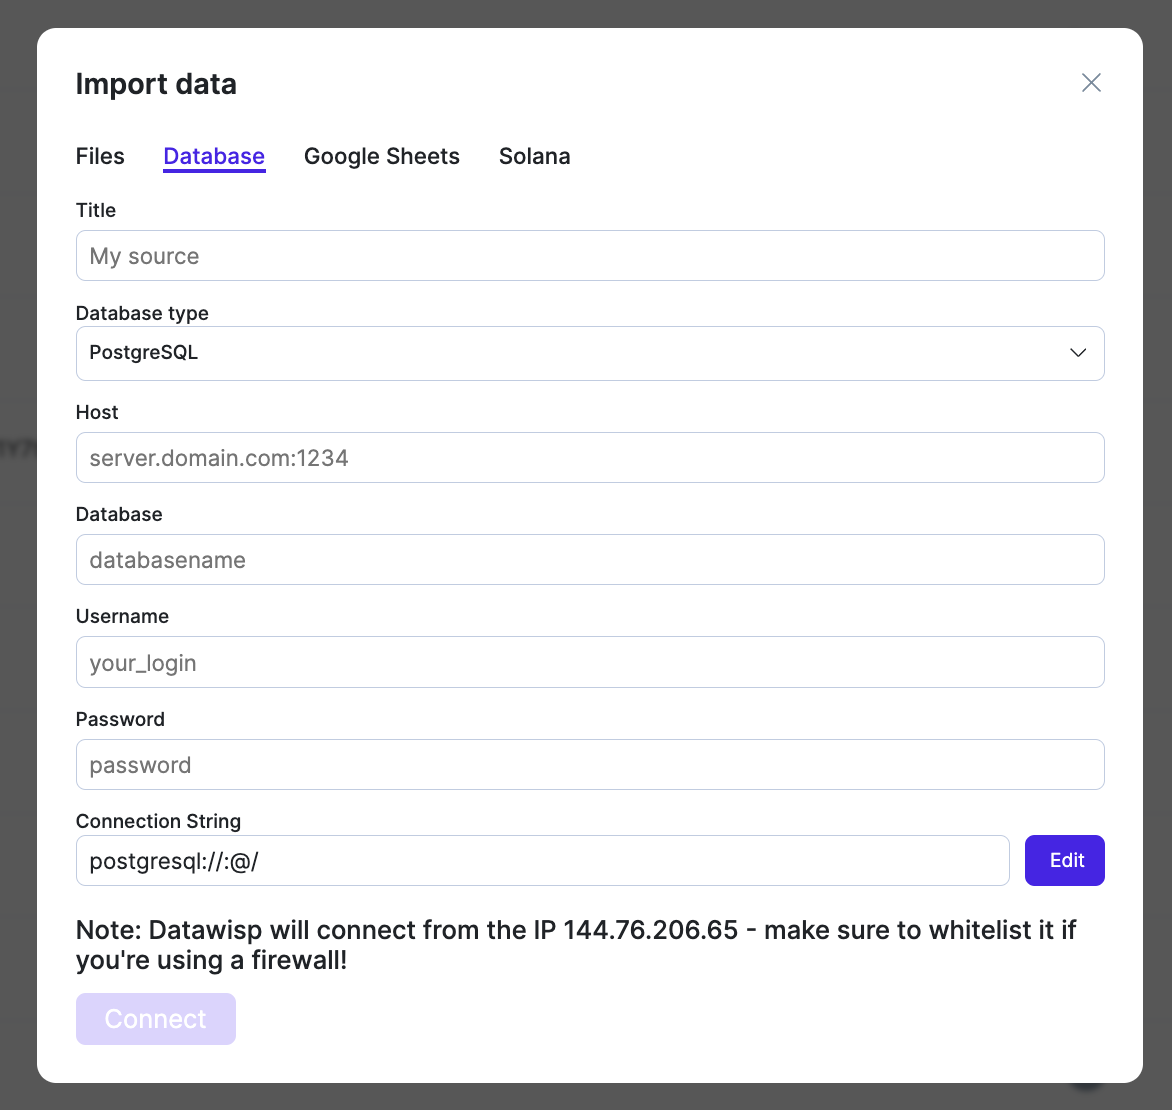
Imports - Amazon Redshift and Snowflake!
We’ve added support for Microsoft SQL Server, Amazon Redshift, and Snowflake. Google BigQuery is also in the works, and should land soon. All of them have gotten full support for all features, including the fast remote querying.
During this we’ve learned a ton, and a surprising amount can be boiled down to “T-SQL is a weird SQL dialect.”
Now that we support 7 database engines, we also added some infrastructure, so we can test new and old features in all databases simultaneously. That was a bigger undertaking than we initially thought, because creating sample data that works the same way in all of these databases was surprisingly time-consuming!
That said, we’re really happy with how well it works, and are much more confident pushing out new databases in the future.
Oh, and we’ve also reworked the import dialogue for databases to be more intuitive. Still not 100% where we want it (that will require some changes to our backend), but the new version is much better.


Other improvements
We’ve added a “Table Source” block, where you can just paste some data into a sheet, without having to upload it. It’s really neat to create examples.
We’ve completely reworked comments. Comments are now much easier to use, support full markdown, and, most importantly, can even embed videos. Well, that’s not the most important part, but the coolest part.
You can now sort data sources by owner, type, when it was last imported, instead of the default order.
If you have two sheets with the same name in the same folder, they now get highlighted, so you can figure out what’s what.
We’ve added an entire new block, Calculate+. You can write down some formulas to do math much more easily.
We’ve added loading spinners to all outputs, if the computation takes a couple of seconds
And of course, we’ve also squashed a bunch of bugs, including an annoying bug where Datawisp would not load, if it was in a bad state in a different tab.
That one was fun to track down, and had been haunting us for months. Only occurring very occasionally, and never in a way we could reproduce. We finally were able to replicate it when two developers experienced it simultaneously, and from there, the fix was easy.
In the end, we’re now much more confident in our product than we were just a month ago. We’re committed to aggressive testing with users in order to create a product that makes data more accessible and that users enjoy. If you have any feedback, please reach out!