

Datawisp DevUpdates | October 2023 - Simplifying the User Journey, Easy Onboarding, Better Charts
Here are some of the top DevUpdates for the month of October 2023 - Follow us on Twitter and LinkedIn for more DevUpdates!
We launched version 1.0 last month and things are moving fast! We’re now enjoying a steady flow of users to Datawisp and we’re diligently learning from how they are experiencing the platform.
Our main focus this month has been identifying areas where people are getting stuck at each stage of the user journey and building ways to help - from onboarding to working with data to visualizing a user’s data - Datawisp now contains helpful content to make the whole experience feel easy.
Easy Onboarding
We found that many users were getting stuck deciding where to begin, so we put a lot of work into making our onboarding simpler - clear choices that make a user feel comfortable getting started.
We made lots of progress in this area:
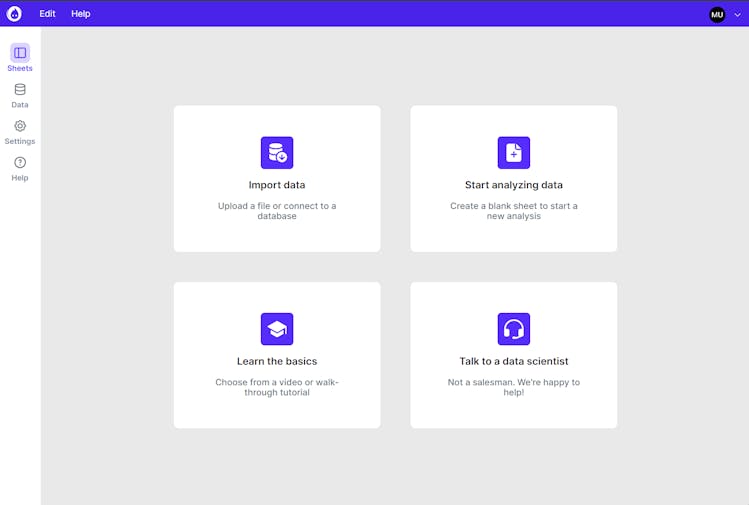
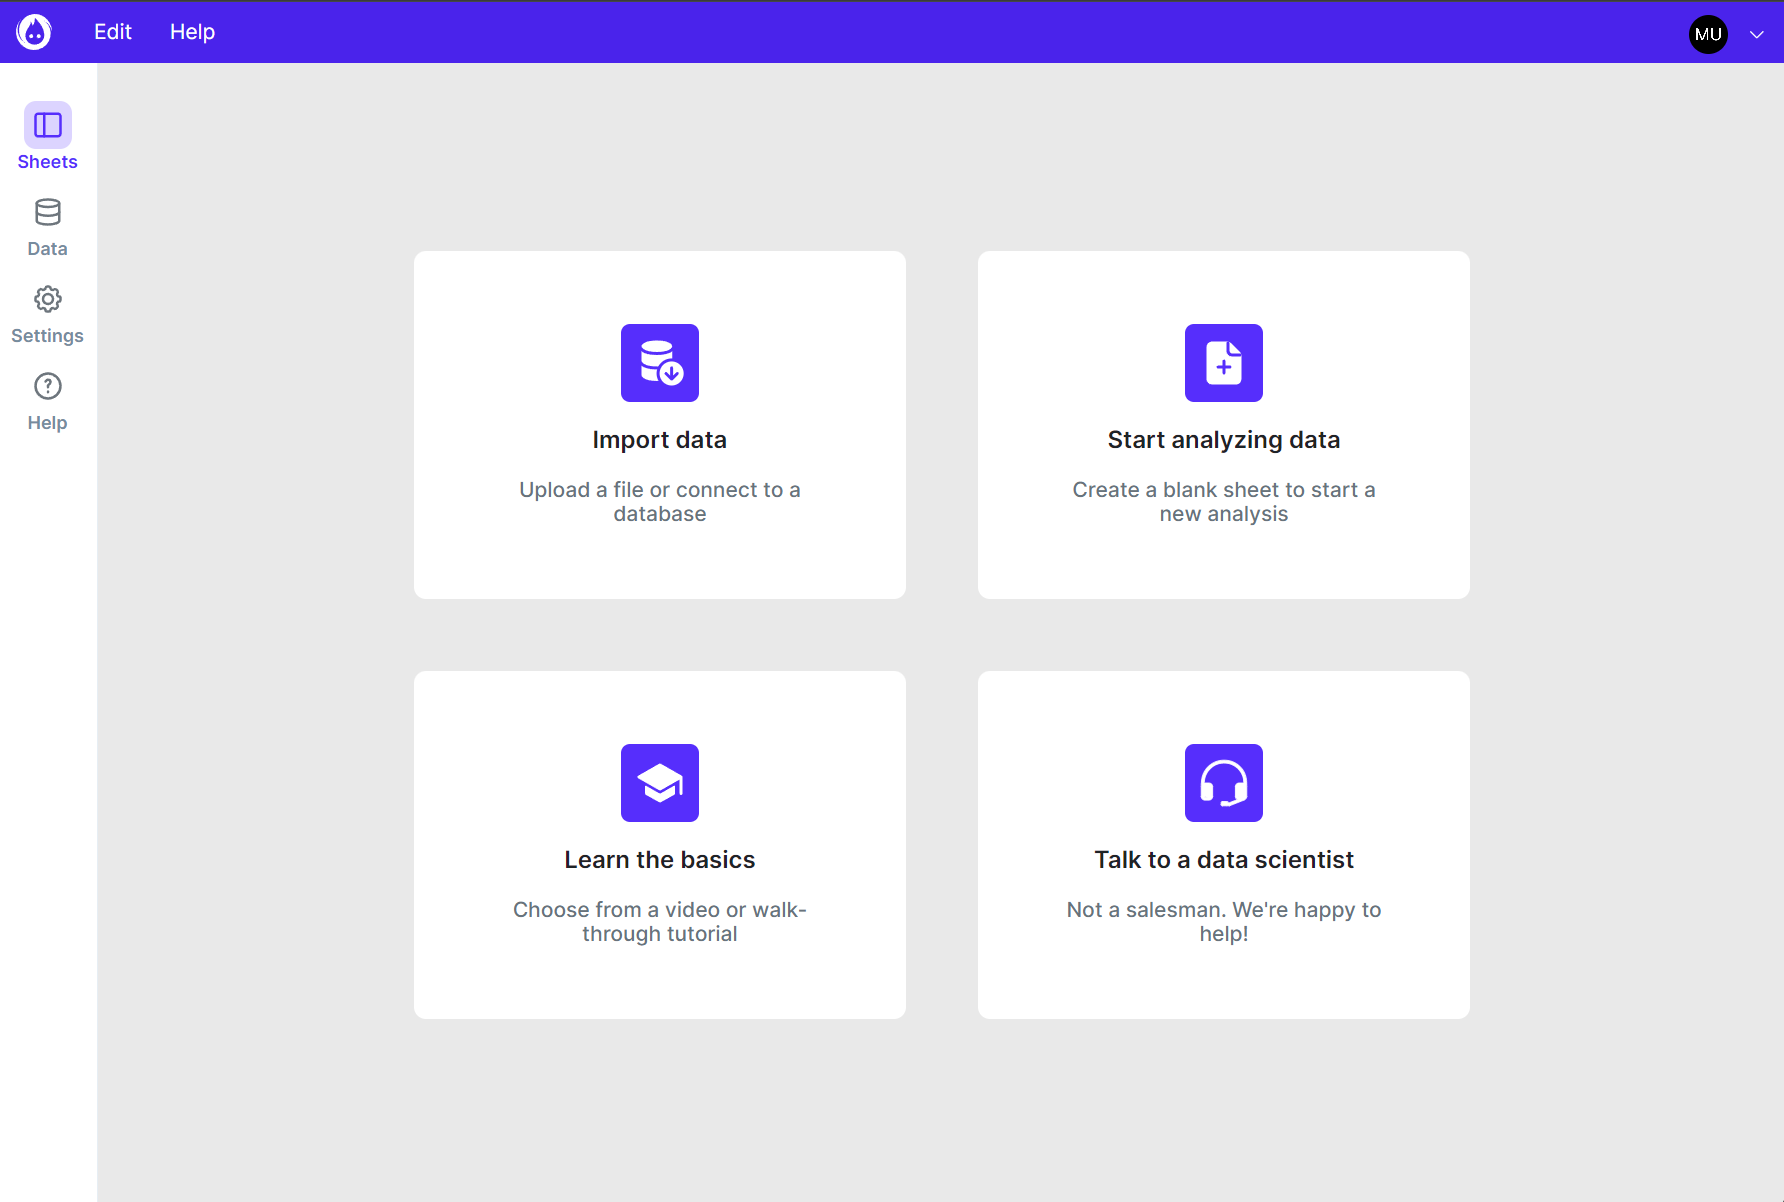
The “welcome” screen has been completely reworked.
We’ve created new materials that should help new users get started. Under “Learn the basics”, users can now try out an interactive tutorial.
We built an option where if a user gets stuck, they can talk to a data scientist.
We created more options to log in - in addition to Google, we also support GitHub, LinkedIn and more!
We’ve redesigned our onboarding screens to be easier to read, and quicker to choose from.

More Intuitive Data Source and Other Block Improvements
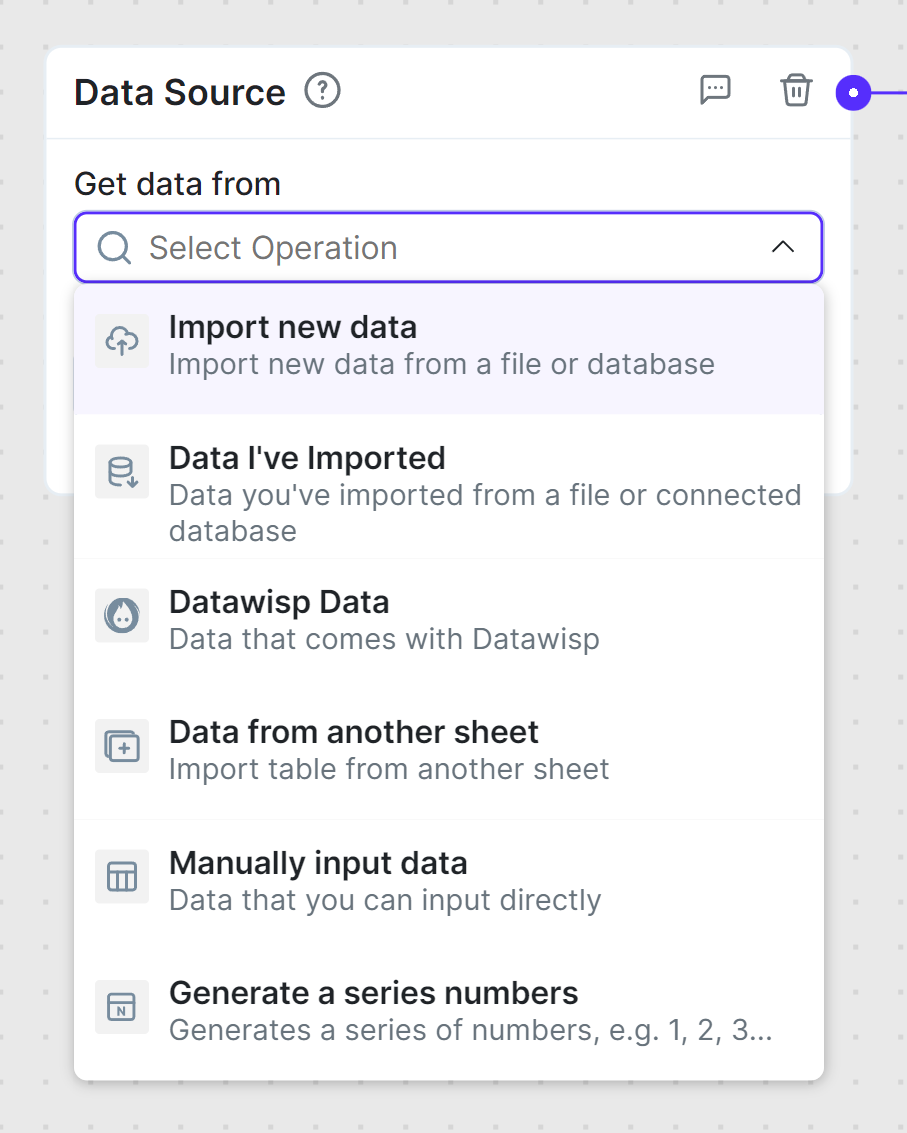
Once a user opened a sheet, we found it was difficult for them to clearly see all the options for their first step - working with a data source. This made it challenging to see just how much they were able to do at this step - from importing their own data to working with our Datawisp library of preloaded data sources.
We made a ton of changes to make this look and feel easy - the data source block below is much improved and clearly shows the full range of options available to the user.


We made similar improvements and optimizations for many of the blocks, for example:
We’ve optimized date operations to run remotely on all databases that support remote querying - faster computations, with no effort from the user!
Every single dropdown in the product has been optimized. They’ll never go off-screen anymore, promise!
Summarize & Group can calculate the minimum / maximum of dates
We’ve added more date operations to the “Add Column” block, to allow more flexibility when working with dates.
The combine block now let’s a user add prefixes when joining two data sources
Many small changes, from rewording a couple of labels to re-inventing entire blocks
Better Charts
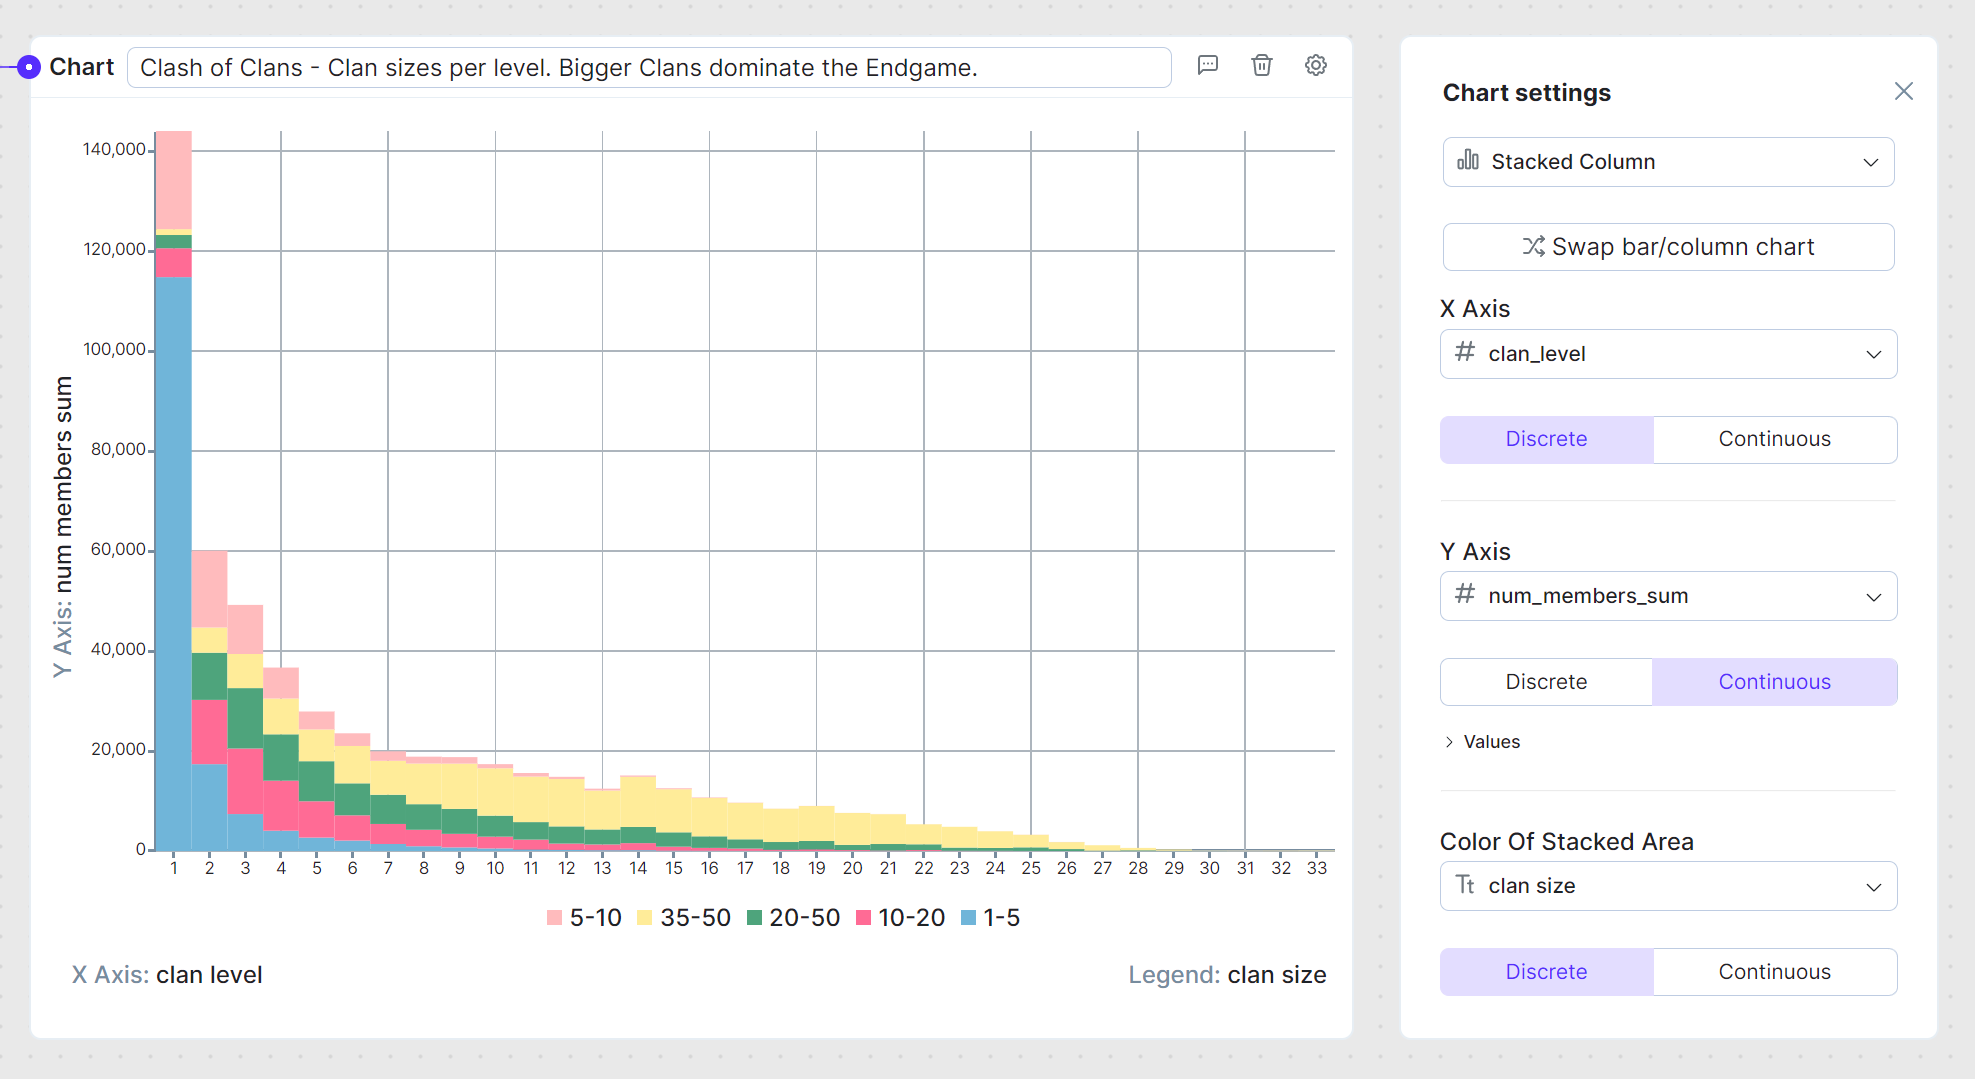
Finally, during the final step of visualizing data, some users had trouble customizing charts to their liking - either we didn’t include their favorite chart type or we were missing a field where they wanted to customize their chart as they were used to doing in spreadsheets. We made several changes to make this experience much better:
We added more types of charts
Made existing types easier to use
Fixed a lot of edge-cases where charts did not look great
… and many more small improvements.


Looking Ahead
This past month has been very much focused on making Datawisp as easy to use as possible. Given our mission to make working with data easy - this will be an ongoing process - we always need to strive to make our product easier, simpler, and more intuitive.
However, we think we made huge strides this month and we’re now comfortable with the simplicity and the feature offering for new users.
The next step in making Datawisp easy for the non-technical user is to continue work on our AI offering where a user can ask questions in plain language and get Datawisp sheets built for them automatically. We’ll be dedicating next month to kicking off this process and will be sure to update you along the way! If you have any feedback, please reach out!