Eating The Dog Food: How We Use Data Internally At Datawisp
Startups often (as the expression goes) “eat their own dog food.” Datawisp is no exception to that: it would be pretty unacceptable if we - a data company building a product to empower more data driven decision making across organizations - didn’t use data to inform our internal processes. Here’s a quick overview of some metrics we track and how we use them to make better business decisions:
Product development
We measure pretty much everything that happens in our platform. If there’s a button you can click or an action you can take, we track it: how often users import data, what kind of data they import, how often they interact with Wispy, our AI-assistant, and more. Here are some examples of how we use this data:
Prioritizing features: Most companies don’t have infinite development resources. As a startup, we need to make sure we’re constantly prioritizing working on the parts of our product that need the most work; recently, we discovered that the vast majority of our users were importing Excel or CSV files, but we’d spent the least amount of time optimizing those imports. This helped us improve how we handle those file types and increase imports and reduce errors. Moritz, our CTO, uses Datawisp almost daily to make decisions like this.
Understanding customer expectations: by looking at the difference between “ask question” events and “get answer” events, we noticed a lot of users were leaving before Wispy had finished. Looking at the time difference between these events helped us realize Wispy was too slow and users weren’t willing to wait that long, so we focused on improving its speed. Now a much higher percentage of questions receive an answer and more users ask a second and third question.
Judging changes to our product: When we change our product, it’s typically because we think it’ll positively impact the user experience. We use data to measure whether our changes have the desired effect. Did the new onboarding screens retain more users? Did the AI improvements increase retention? There’s only one way to find out.
Catching / fixing bugs: a few weeks ago we introduced a bug that broke our AI and the number of questions answered dropped off a cliff. Noticed this immediately and looked into the issue. Metrics went right back up!
Marketing
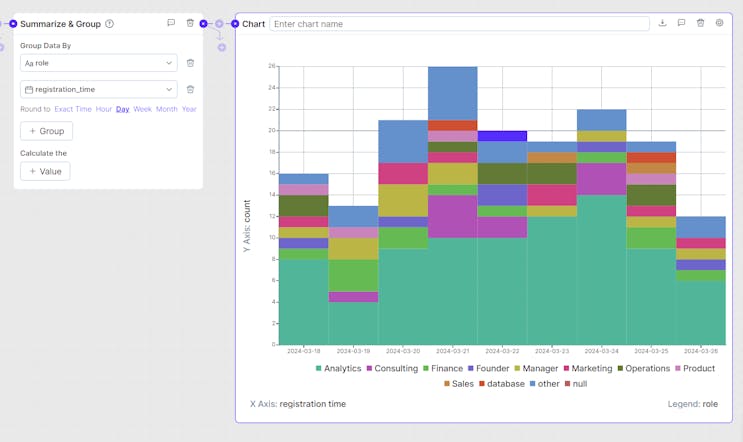
We use Datawisp to combine our Google Analytics data and the data our own platform tracks to get deeper insights into where users are coming from and what they’re doing when they get to us.
Reducing user acquisition costs: we use Datawisp to measure how successful certain campaigns are at attracting users that behave how we want them to in our product (import data, ask questions, etc.). We combine the GA data with our own data to do this. Dan, our VP of growth, has reduced our user acquisition cost significantly by finding keywords that attract less desirable users.
Better understanding user segments: Datawisp can easily filter users by any number of attributes - such as a .edu email address - to see if certain groups (e.g. students) use the product differently than others. This in turn can inform product direction, content creation, marketing campaigns, and more.
TLDR
Companies today generate more data than ever before, yet very few people within an organization actually leverage that data to make better business decisions. At Datawisp we’ve found that the more we base product and marketing decisions on actual data - instead of our gut and feedback from friends and family - the more our KPIs go up. We use data, and Datawisp, to make decisions across almost every aspect of our business - and you should too!
If you want to start making more confident, data-driven decisions, but aren’t sure where to start, let’s chat! Alternatively, check out Datawisp.io and sign up for a free trial today.