

Exploring churn and progression data with Datawisp: Candy Crush level difficulty and user retention
In this video, we use the Datawisp platform to explore sample user session data from Candy Crush and choose some datapoints a game designer might focus on to boost retention and revenue growth. (transcript follows)
Full Transcript:
0:01 Hi, I'm Dan. I lead business development for data wisp. So we think everyone should be able to take part in the insights finding process, and we want to help by making, working with data as easy as sending an email.
0:11 Today I'm gonna show you just how easy it is to start using the platform to find insights for yourself and create a visual script like this using a real example.
0:21 So in just a few minutes, I'll show you how we import the data, transform it into something useful, and get insights.
0:27 And so for the example, we're gonna be using data from Candy Crush. The data set that I'm using contains 15 levels and additional detail for user behavior in each of those levels.
0:39 It's a very simplistic data set, but hopefully shows you some basic functionality of the platform and I can point to some areas where you can customize and eventually do more complicated tasks like joining different data set together to do advanced analysis.
0:58 So here's what the data looks like. It's currently in a Google sheet, contains user session data, and each row shows a session per user and you can ultimately see what level they tried, how many attempts, and whether they succeeded or failed.
1:15 And so to upload this data into data was platform. It's using very easy sharing features that has built into Google.
1:24 So I sit here and I click share and I allow access to anyone with the link and I just copy the link and then I'll import this into the Data W platform.
1:38 Then here I am in the Data W platform, and so I want to go to the data sources tab and I can just hit import here.
1:46 As you can see, there's a bunch of different import types that we support currently. We're gonna go to Google Sheets for now, and I want to just name the data that I want to import.
2:00 So let's call it Candy Crush Demo. And I just copy and paste that Google share, like, and hit import. And in a few seconds we'll have the data uploaded to the platform.
2:16 And there we go. And so now that we've got our data within the data wis platform, we can create a sheet and start to explore that data.
2:25 And so I'll create a new sheet here, let's call it Candy Crush Demo. And let's input that data that we just added from the source.
2:39 And as you can see, you can preview the data set. Here's all that data that we just viewed from the Google sheet, and it's got all the same columns and rows data, which automatically determines what type of data has just been imported.
2:57 And then what we can do is we can start to manipulate that data with logic blocks. And so these are, these can be really powerful and if you know sql, you'll know that syntax can be challenging.
3:13 You don't have to worry about that with this visual query builder. And so let's say for in this Candy Crush example, I wanna understand something about the number of attempts per level.
3:28 I can use this aggregate block to start to summarize different rows by level, and then I can create a table with that output.
3:41 As you see really quickly and easily, we've uploaded that source data, transformed it, and turned it into insights that we can immediately start to analyze.
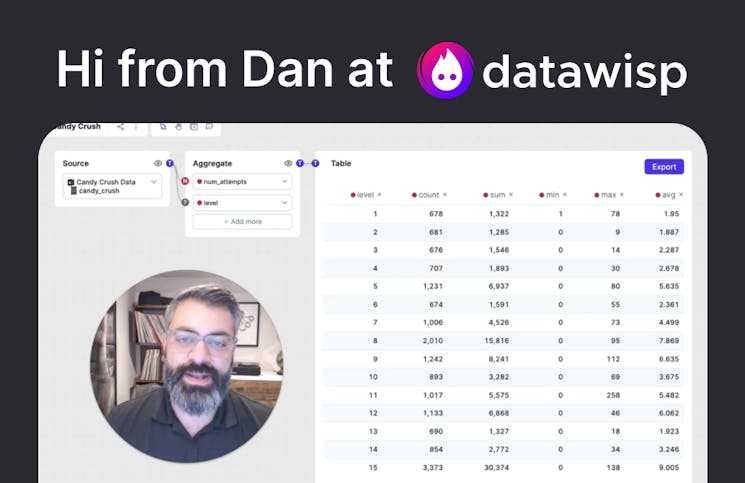
3:52 So here we have all our levels one through 15 with a lot of different summary columns, and I'm not gonna go through all of these columns, but just just a few to give you an idea of how this works.
4:07 So for each level, we can now see what was the max number of attempts per user. And for level one, someone tried it out 78 times and they tried it.
4:21 On average users tried the first level twice. If I were to gather some insights from this data, I might start to look at what were the most challenging levels on an average user basis.
4:37 So like level five has been tried on average 5.6 times level eight, nine, and 15 all start to get above, above six times.
4:51 And so these are areas that are, are more challenging for the user. If you are game designer, you might wanna start thinking about, okay, are there ways that I can start to incentivize the player to purchase booster packs or make these more challenging levels more accessible to different users in order to increase retention?
5:14 Obviously your user data is gonna be much more complicated than this. Your retention analysis may become more, much more complicated than this.
5:23 But the thing that's interesting about the data waste platform is that it gives you full flexibility to be able to, for example, join another dataset so I can add an additional data source and connect it here and start to join more data into my analysis.
5:40 So very simple example but hope that is helpful and we hope to give more complex and complicated examples in the future and can also do so over a demo.
5:56 I hope you found that you can find out more information on our website, data wisp.io. There's a link on here where you can schedule a demo.
6:04 We love to give demos and talk about the product. You can also try it out for yourself. It's in open beta right now, so free to try.
6:12 And we also have a lot of different resources here where you can learn more about the product. You can read our blog where we do deep dives using real data, using the platform.
6:24 So come check us out and talk to you soon.